
Abstract
This report showcases the state of the Software and Data industry in 2022 from the perspective of startups. Offering an indepth look into the top 30 cities for Software and Data in 2022 as well as the top Unicorns, Exits and Pantheons, this report expands on the findings of the Global Startup Ecosystem Index. Software and Data represent the biggest industry for startups for the second year in a row, having a considerable sample size of startups and an increasing number of unicorns.
Software and Data Industry at a Glance: top insights
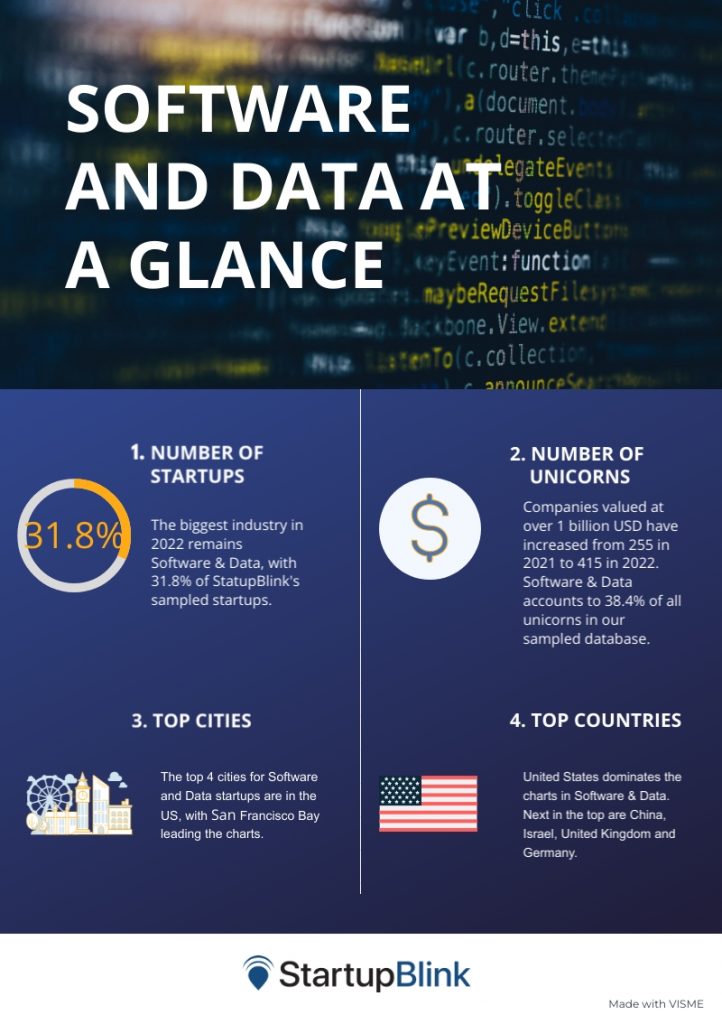
➡️ In 2022, the biggest industry in the StartupBlink Index remains Software & Data, with 31.8% of our sampled startups. On the Startupblink Ecosystem Map, we have identified 12 sub industries for Software and Data, with the biggest being Enterprise Technology (23%), Apps (19%) and Data Analytics (12%).
➡️ The Unicorn count in this industry also increased substantially, from 255 Unicorns in 2021 to 415 Unicorns in 2022.
➡️ the United States dominates the top 30 destinations for Software and Data startups, boasting 14 startup ecosystems that overperform in this industry. The top 7 cities in rank order are San Francisco, New York, Boston, Los Angeles, Beijing, Tel Aviv, and London.
Ranking the top 30 Cities for Software and Data
Software & Data has the highest scores out of all the industries, as it is the industry with the most startup activity. The top 7 cities in rank order are San Francisco, New York, Boston, Los Angeles, Beijing, Tel Aviv, and London. The only ranking change in the top 7 this year in Los Angeles and Beijing switching places.
Like other industries, San Francisco’s contenders are closing the gap. New York (ranked 2nd), Los Angeles (4th), Tel Aviv (6th), and London (7th) decreased their gap with San Francisco from 400%, 680%, 859%, and a staggering 1030% respectively in 2021 to 214%, 398%, 438%, and 498% this year. With some exceptions, gaps in scores between cities are material, hence the relative stability in this industry ranking. Exceptions include Bangalore and Toronto, gaining 5 and 7 places respectively.
The two biggest overperformers here are Kyiv, Ukraine, which ranks 68 places higher than its global rank despite dropping by 6 positions, and Madrid, Spain, gaining 14 places and now overperforming by 20 spots. Moscow has dropped significantly, aligning with the drop in its overall ranking.
Software and Data Unicorns in 2022
- Acronis (Schaffhausen, Switzerland)
- Nord Security (Vilnius, Lithuania)
- VerSe Innovation (Bangalore, India)
- Veriff (Tallinn, Estonia)
- Tripledot (London, United Kingdom)
- Staffbase (Chemnitz, Germany)
- Pentera (Petah Tikva, Israel)
- NoBroker (Bangalore, India)
- Moon Active (Tel Aviv-Yafo, Israel)
- Hasura (Bangalore, India)
Software and Data Pantheon Members in 2022
Pantheon members is a category coined by StartupBlink which includes companies or organizations that are no longer a startup or a unicorn, but still have a substantial impact on their startup ecosystem and its brand. These Pantheons are categorized into three tiers depending on their impact and quality. Below are some of the pantheon members that are making a notable impact in the Software and Data industry.
- Statista (Hanburg, Germany)
2. Skype (Stokholm, Sweden)
3. Infosys (Bangalore, India)
4. Mobileye (Jerusalem, Israel)
5. Rocket Internet (Berlin, Germany)
6. SAP Software Solutions (Heidelberg, Germany)
7. Checkpoint (Tel Aviv-Yafo, Israel)
8. UiPath (Bucharest, Romania)
9. Naspers (Cape Town, Africa)
10. Wix (Tel Aviv-Yafo, Israel)
Software and Data Exits in 2022
- Telxius (Madrid, Spain)
- Outfit7 (London, United Kingdom)
- Mimecast (London, United Kingdom)
- Innovo Innovation (London, United Kingdom)
- Checkmarx (Ramat Gan, Israel)
- Blue Prism (London, United Kingdom)
- AR Packaging (Malmö, Sweden)
- Adjust (Berlin, Germany)
- Atria Convergence Technologies – ACT (Bangalore, India)
- 99 (Sao Paulo, Brazil)
Methodology
To ensure that the rankings are as accurate as possible, we have based our algorithm on objective, quantifiable data that can be comparatively measured across regions, countries, and cities. We refrained from using subjective tools such as surveys and interviews, and instead utilized data that was either accumulated directly from the StartupBlink map or has arrived from integration with a reliable global data partner. We allow as few assumptions as possible regarding cause and effect and focus on one thing: measuring results. We avoid relying on any theoretical models assuming the causes of success for startup ecosystems.
Every year our algorithm is more accurate, and it should be noted that the momentum change of each ecosystem is not only influenced by its achievements over the last year, but also by these algorithm improvements. We have been sampling startup ecosystem data on the curated and interactive StartupBlink Global Map, which enables us to test and perfect our algorithm based on vast sets of data. We estimate that the core map dataset has a representative sample covering 10-15% of total relevant entities in global startup ecosystems. In addition, hundreds of thousands of entities and data integrations are taken into account via our global data partners. Each location’s final score is based on the exact same algorithm. However, we are aware that our sample size fluctuates depending on location and data sourcing. Our only intervention in the score is discounting locations where we determined that the sample size of the entities is higher than average. In order to solve issues with lower than average sample size, we have partnered with approximately 100 Ecosystem Partners, most of which are Government agencies, many of them in locations where our data is limited. We offer all governments administrative access to curate the dataset of their ecosystems, at no cost, granting them complimentary access.
The Methodology used in the 11 industry rankings, including Software and Data, is identical to the algorithm of the global rankings, while taking into account the startup database of each industry. However, the fintech Industry rankings are built on an official Fintech Ecosystem Portal: Findexable’s Global Fintech Map, which includes deeper algorithm changes that are customized according to the specific characteristics of the fintech industry.
Our Data Partners:


People reacted to this story.
Show comments Hide comments[…] in Cape Verde. The Startup Map shows a sample of 23 Marketing & Sales companies in Cape Verde, 7 software startups and Data startups in Cape Verde, and 5 Marketing & Sales startups in Cape […]
[…] Read more […]
Comments are closed.