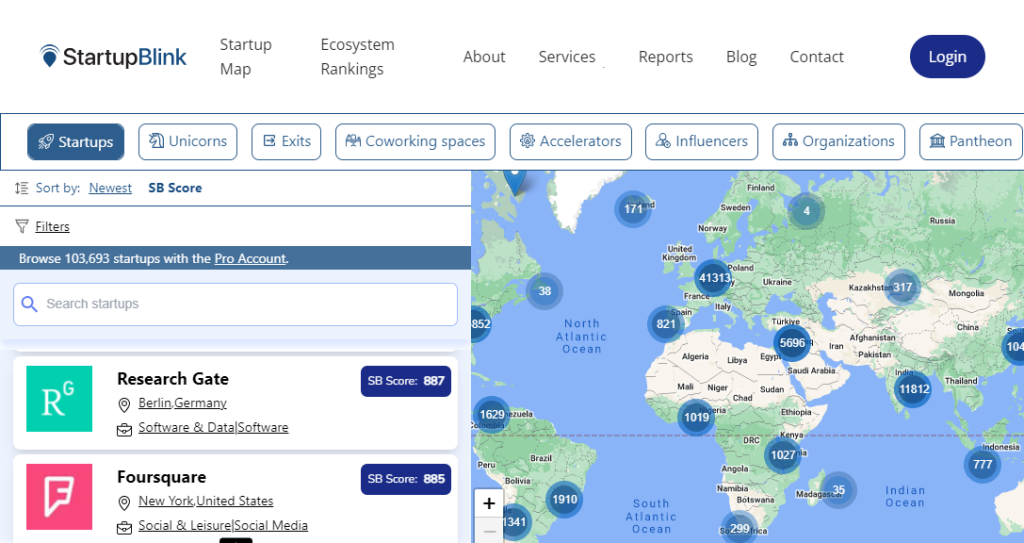
StartupBlink’s Global Startup Ecosystem Index is a ranking system that ranks ecosystems worldwide in 1,000+ cities and 100+ countries using dozens of parameters assessing startup ecosystem success.
This Index, first published in 2017, utilizes a sophisticated algorithm that takes into account a wide range of data and parameters. It incorporates inputs from esteemed global partners such as Crunchbase, Statista and Semrush.
StartupBlink is also partnering with over 100 government organizations Taiwan Tech Arena, Enterprise Singapore and ACCIO, helping StartupBlink to gather local data to represent their ecosystem accurately in the Index, Global Map and Ecosystem Dashboards, used by hundreds of thousands of stakeholders globally.
Learn more about the dozens of parameters influencing your startup ecosystem’s rankings.
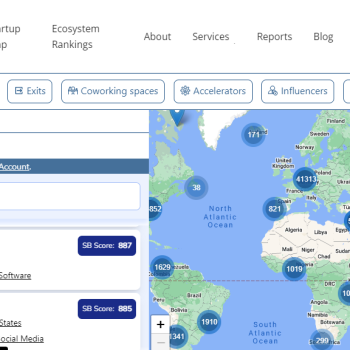
Additionally, it uses crowdsourced data from the StartupBlink Global Startup Ecosystem Map, which has been consistently updated since 2013. The map offers a detailed snapshot of the various stakeholders within each startup ecosystem. To further enhance your understanding, our platform also provides interactive dashboards that offer in-depth insights into the ranked cities and countries’ startup ecosystems.
Every year, StartupBlink’s Index is used by hundreds of thousands of startup founders, startup ecosystem developers, corporations, and other stakeholders to support critical decisions on policy-making, strategy, relocation, and investment. Additionally, StartupBlink leverages the Index and its vast underlying data sets in various analyses and consulting projects focused on developing startup ecosystems for governments and international organizations. This includes providing guidance and recommendations in policy, strategy, and investment areas. If you would like to get more information on how our data can help you to strengthen your startup ecosystem better, please visit this link.
Data Sources defining Startup Ecosystem Success
StartupBlink Index is built based on multiple data points, with the main ones being:
- StartupBlink’s Global Map which is a crowdsourced platform with hundreds of thousands of startup-related entities.
- Global Data Partners, such as Crunchbase, SEMrush, Statista, and BrightData.
- Ecosystem-specific data coming from approximately 100 Ecosystem Partners, mainly government agencies. Join them to represent your ecosystem accurately in StartupBlink’s Index.
Guiding Principles for Assessing Startup Ecosystem Success
In order to achieve the most accurate rankings, our algorithm is based on objective and measurable data that can be compared across different regions, countries, and cities. Rather than relying on subjective methods such as surveys or interviews, we have chosen to use data that has been directly gathered from the StartupBlink map or obtained through a partnership with a trustworthy global data provider.
We aim to minimize assumptions and only focus on measuring results. We do not rely on theoretical models to assume the causes of success for startup ecosystems, as we have learned through our consulting experience that every ecosystem is unique and that what works in one may not work in another. Hence, StartupBlink’s GSEI does not measure innovation or implementation of advanced policies related to city development.
A trade-off for most annual rankings is maintaining the consistency of the algorithm and innovating on new elements to improve or adapt the algorithm to changing business environments. We prioritize consistently updating our algorithm so that our stakeholders can depend on our results for informed decision-making. Each year, our algorithm becomes more accurate. It is important to note that changes in an ecosystem’s ranking are determined by the ecosystem’s performance in the past year and by advancements in our algorithm.
It is important to keep in mind that StartupBlink’s GSEI is comparative. A decrease in ranking doesn’t necessarily mean that the ecosystem has performed worse than the previous year; it could simply mean that other ecosystems have grown faster and overtaken it in the rankings.
If you would like a more comprehensive overview of the algorithm, we invite you to get a StartupBlink PRO account. This account provides raw data for all ecosystems, specialized filters on the map, options to export data, and access to raw and processed components of our algorithm.
Distinction Between Countries and Cities Rankings
Each year, we present two sets of rankings: One for countries and one for specific individual ecosystems nestled within the cities. We present only the top 100 countries and the top 1000 cities. Yet, our database includes additional locations. However, we observed that accuracy decreases the lower an ecosystem is ranked, generally due to the limited number of relevant entities in low-ranked locations.
In some cases, it is possible to observe that the momentum of a specific country and the ranking of its cities might be contrasting due to several reasons, such as:
- Our country rankings consider population size, but city rankings do not, in order to adjust the expectations between countries with smaller and larger populations.
- Within a specific country, some cities may see an increase in rankings while others decline. This is particularly relevant in countries with multiple cities in the top 1000, like the United States, which has multiple cities that fluctuate in their rankings.
Why doesn't my city appear in the StartupBlink rankings?
The first reason can be due to clustering, as part of StartupBlink methodology. We cluster cities in cases where they are part of a larger urban area. San Francisco Bay Area is a well-known example, which encompasses multiple cities such as San Jose and Palo Alto. A similar principle is applied to other locations worldwide when they are considered a part of the same ecosystem.
By grouping urban areas into one ecosystem and not considering the population size in our algorithm, it may seem like we are favoring bigger cities. But it’s not our algorithm that provides the advantage, it’s reality. Due to the larger number of entrepreneurs and economic activity, bigger cities are more likely to perform better than smaller cities. Still, if you use the population filter in the interactive map ranking tables, there are some instances of small cities punching above their weight, such as Santa Barbara, California (USA), Kingston (Canada), Cambridge (the United Kingdom), and Boulder, Colorado, (USA).
The size of the domestic market also plays a key role in ranking advantages for startup ecosystems. Ecosystems in countries with large populations and markets have the potential to grow startups much larger without competing on a global scale. Examples of this are ecosystems in countries like China, India, Indonesia, Brazil, and Russia.
The second reason can be that your city or country does not have enough data to be present among the 1,310 cities and 119 countries we rank.
You can contact us to discover why your city or country is not ranked, and how we can increase the visibility of your ecosystem.
How does the domestic market size affect startup ecosystem rankings?
Another important element that provides a ranking advantage to startup ecosystems is the size of the domestic market. Ecosystems with a massive population and market can scale startups much larger without competing internationally. Examples include ecosystems in countries such as China, India, Indonesia, Brazil, and Russia. Although ranked high on their total output, these locations are mainly innovating locally and catering to their massive internal markets.
How does the index account for recent events in rankings?
Our index includes a fading mechanism which provides full impact to events (for example, the birth of unicorns, exits and investments) that have happened in the last 12 months, while gradually fading that impact over 10 years. This allows us to make sure that the rankings are more influenced by recent events than powerful histories, and ensures startup ecosystems cannot coast on past successes. Lastly, it should be noted that this Index presents both the ranking and momentum of ranked cities and countries; our StartupBlink Pro users enjoy access to a per ecosystem breakdown of performance and momentum across each of the dozens of parameters used for the index.
Factors for Assessing Startup Ecosystem Success
The success of each ecosystem is assesed by a total score, which is computed by summing up three subscores for Quantity, Quality, and Business environment.
Quantity Score
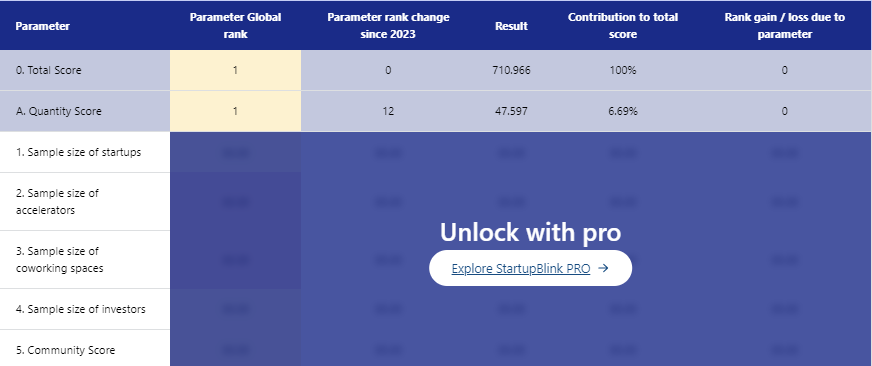
A succesful startup ecosystem is made up of not just startups themselves but also organizations that offer resources, networking opportunities, and access to funding. The Quantity score measures the level of activity within an ecosystem by assessing the participation and involvement of its key players and stakeholders. The Quantity score is calculated based on the following elements:
- Number of Startups
- Number of Coworking Spaces
- Number of Accelerators
- Number of Investors
- Number of Startup related Meetups
Some of this data arrives from our Global Data Partners, such as CrunchBase and MeetUp. StartupBlink Pro users can unlock the dozens of performance parameters by Quantity Score, Quantity score as well as Business Environment Score and Industries on thousands of ecosystem dashboards.
Quality Score
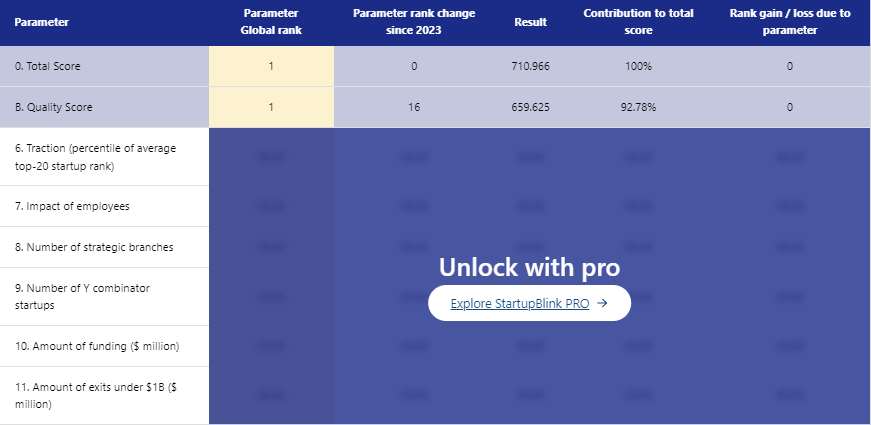
The Quality Score presents the qualitative results achieved by an ecosystem. We have utilized various integrations with partners, such as Semrush and Crunchbase, and have analyzed hundreds of thousands of data points in order to assess the Quality of each startup ecosystem. The elements of the Quality Score are:
- Total accumulated private sector startup investment
- Total accumulated number of startup sector employees
- Number and size of unicorns and exits above US$1B
- The traction of startups in each ecosystem (including traffic, domain
- authority, and customer base)
- R&D centers of multinational technology companies (e.g. Alphabet,
- Microsoft, Meta, Cisco)
- Branches of multinational companies and brands (e.g. WeWork spaces)
- Total accumulated value of exits with a valuation below US$1B
- Number and size of global startup events and conferences
- Presence and impact of Pantheon members
- Presence and impact of Global Startup Influencers
- Number of startups accepted by top global accelerators per ecosystem
- Number and market capitalization of listed companies in technology sectors
StartupBlink Pro users can unlock the rankings by Quality Score.
Business Environment Score

The final component assesing the startup ecosystem is the Business Environment Score. It primarily concentrates on factors at the country level, as national infrastructure, policies, and legislation typically impact all cities within a given country.
If used independently, the StartupBlink unique business index showcases the difference between the activity of entrepreneurs in each country (quantity and quality scores) and the effectiveness of governments in creating business conditions that allow startups to flourish.
The Business Environment score is calculated with a weighted average that considers a wide range of elements within each country, as outlined in the list below:
- Diversity index
- Internet speed
- Cost of internet
- Internet freedom
- R&D investment
- Availability of various technological services (payment portals, ridesharing apps, cryptocurrency)
- Level of English proficiency
- Passport strength
- Availability of startup or nomad visas
- Corporate tax rate
- Startup-friendliness of labor laws
- Corruption perception index
- Top universities per location
Additionally, the Business Environment score also factors in a minimum threshold of activity in a city, which helps to explain some of the score variations between cities within the same country. StartupBlink Pro users can unlock the full rankings by Business Environment Score.
In line with our policy of not making assumptions about the factors that contribute to the success of an ecosystem, we do our best to avoid indicators that may have an uncertain impact and only consider those that are negative or positive. For example, a lack of access to reliable and fast internet, or strict limitations on internet usage, can pose a significant obstacle to the growth of an ecosystem. On the other hand, we do not consider factors like the cost of living, as this can have both beneficial and detrimental effects on an ecosystem.
Notable Algorithm Changes in 2024
One of the most important changes this year was the discount given to locations with a high density of country code top-level domains, accounting for the fact that this is generally the case in less global ecosystems. Additionally, for the first time, we applied the “fading mechanism,” which assigns more value to recent developments and slowly decreases that value over 10 years for Unicorns. This year, we also added more corporations to the R&D branches parameter, including Meta and Cisco, affecting the Quality score. In 2024, two new parameters were introduced to the Startup Business Environment score: the number of peer-reviewed scientific papers published by the country’s universities and the credit rating given to the country’s sovereign debt by the three most widely used rating agencies: S&P, Moody’s, and Fitch.
Organizations interested in a deeper analysis and insights of startup ecosystems are invited to subscribe to obtain a StartupBlink PRO account. This subscription offers customized data query packages of raw data for all ecosystems, extended access to our database, unique filters on the map, data exporting options, and access to our ecosystem health checks, which break down each ecosystem’s performance on the algorithm parameters.
Industry Rankings Methodology
Aside from the general rankings, 11 industry rankings are calculated by StartupBlink, along with 91 sub industries. Information about these rankings is present throughout the report. The country results section covers each city’s position on specific industries, if they are among the global top 100 for that industry. Our full industry rankings are available online for StartupBlink Pro users. The Methodology used for these rankings is identical to the algorithm of the global rankings, but for parameters that are influenced by industry information, such as startups, funding, and unicorns, we only consider the relevant data.